The beginning
I’m going to do this post a little differently in that I’m starting the project at the same time as creating this post. So this will more or less be a running-dialogue of my thoughts as I’m delving into this project.
I’m trying to create NBA shot charts using data available on stats.nba.com. You can access data by entering a url which should theoretically return a JSON response. I’d like to turn this JSON response into a visual shot chart using vanilla Javascript. Let’s go for it and see how this goes!
Getting data from NBA.com
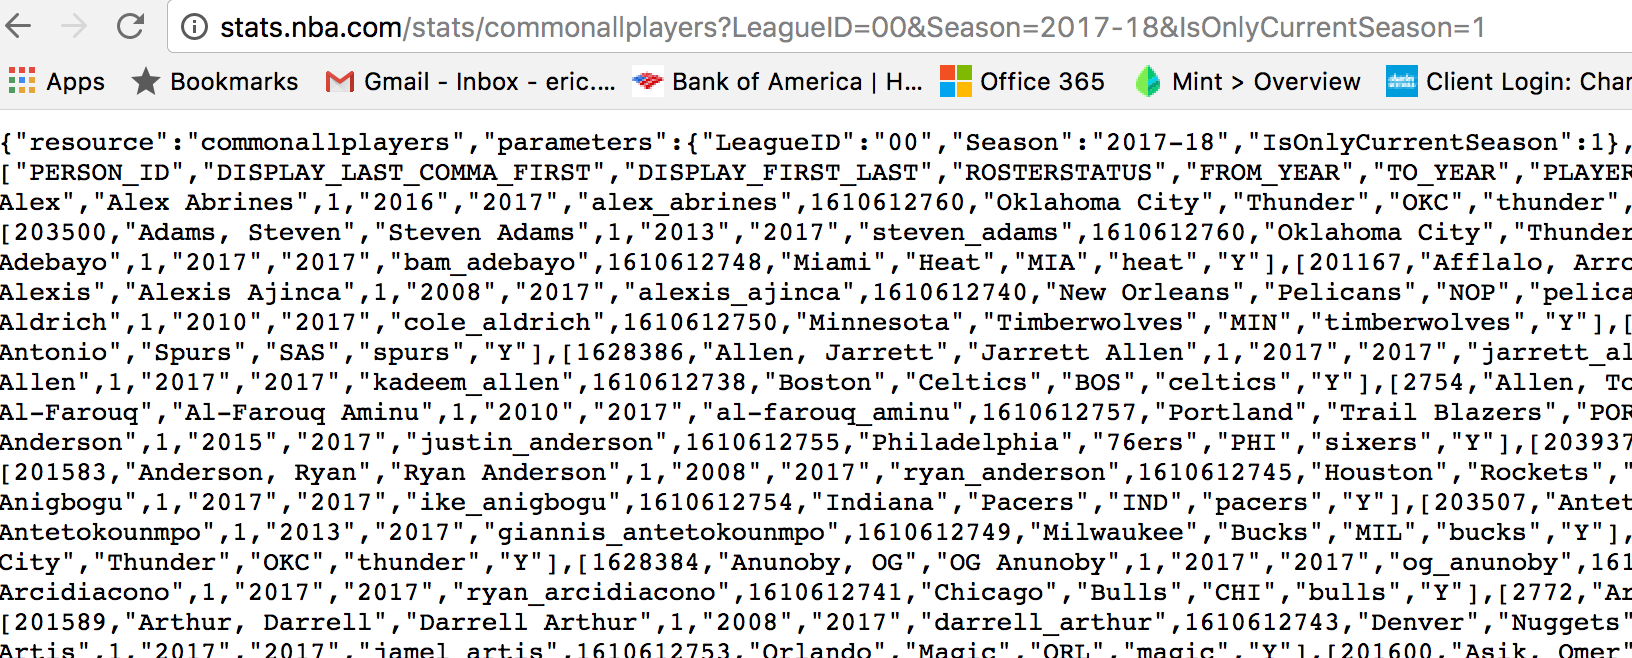
The first step is to try to get a request to return the JSON response as expected. Here is the url that I figured out works for this:
http://stats.nba.com/stats/commonallplayers?LeagueID=00&Season=2017-18&IsOnlyCurrentSeason=1
This is what I got from that:

Great. Now to use my application to make a request to the site. This might get a little harder.
const allPlayersUrl = 'https://stats.nba.com/stats/commonallplayers?LeagueID=00&Season=2017-18&IsOnlyCurrentSeason=1';
var httpRequest = new XMLHttpRequest();
httpRequest.onreadystatechange = function (data) {
  console.log(data);
};
httpRequest.open('GET', allPlayersUrl);
httpRequest.send();
Here’s what I got:

Well then. Let’s see what we can do about that. Maybe somebody wrote a library to figure out a way around this. I’ll look into how to get around CORS later if need be, but for now let’s just try to figure out how to get the data I want.
LO AND BEHOLD! Whoever Nick Bottomley is, you’re a superhero. This library limits me to shots taken in the current season but that’s okay, that’s all I wanted anyway. Time to have some fun.
More coming soon…